XRP Approaching Its All-Time High: A Nuanced Look at Potential Roadblocks
XRP has been on an impressive upward trajectory, inching closer to its historic all-time high (ATH). While market sentiment has been generally bullish, there are several under-the-radar factors that traders would do well to keep in mind. Here’s a closer look at some potential pitfalls:
1 – Profit-Taking from 2017 ATH Levels
XRP’s last major price peak dates back to 2017, and a surprising number of traders still hold substantial positions from that era. These traders may have set take-profit targets near the original ATH. As the price approaches these levels, a quick cascade of sell orders could spark heightened volatility or an abrupt price pullback.
2 – High-Leverage Short Positions Lurking
The current hype cycle—fueled by social media chatter and fundamental news—has attracted a flurry of leveraged trading. Notably, some high-leverage short positions have been biding their time, expecting to benefit from any sudden, hype-induced price spike and subsequent correction.
3 – Liquidity Voids and Volume Analysis
Another consideration is around liquidity voids—areas on the chart where trading volume was thin during prior price movements or vice-versa simply too fast to be filled up all at once due to fast upward momentum. These voids can act as magnets for the price, sooner or later requiring a retest or “fill” when market conditions shift.
4 – Finally, there is the reality that exchanges rely on trading activity to make money primarily through fees. If the market becomes too one-sided—say, nearly everyone is going long and few are opening short positions—exchanges may face liquidity imbalances or reduced earning potential from a shortage of counter-parties.
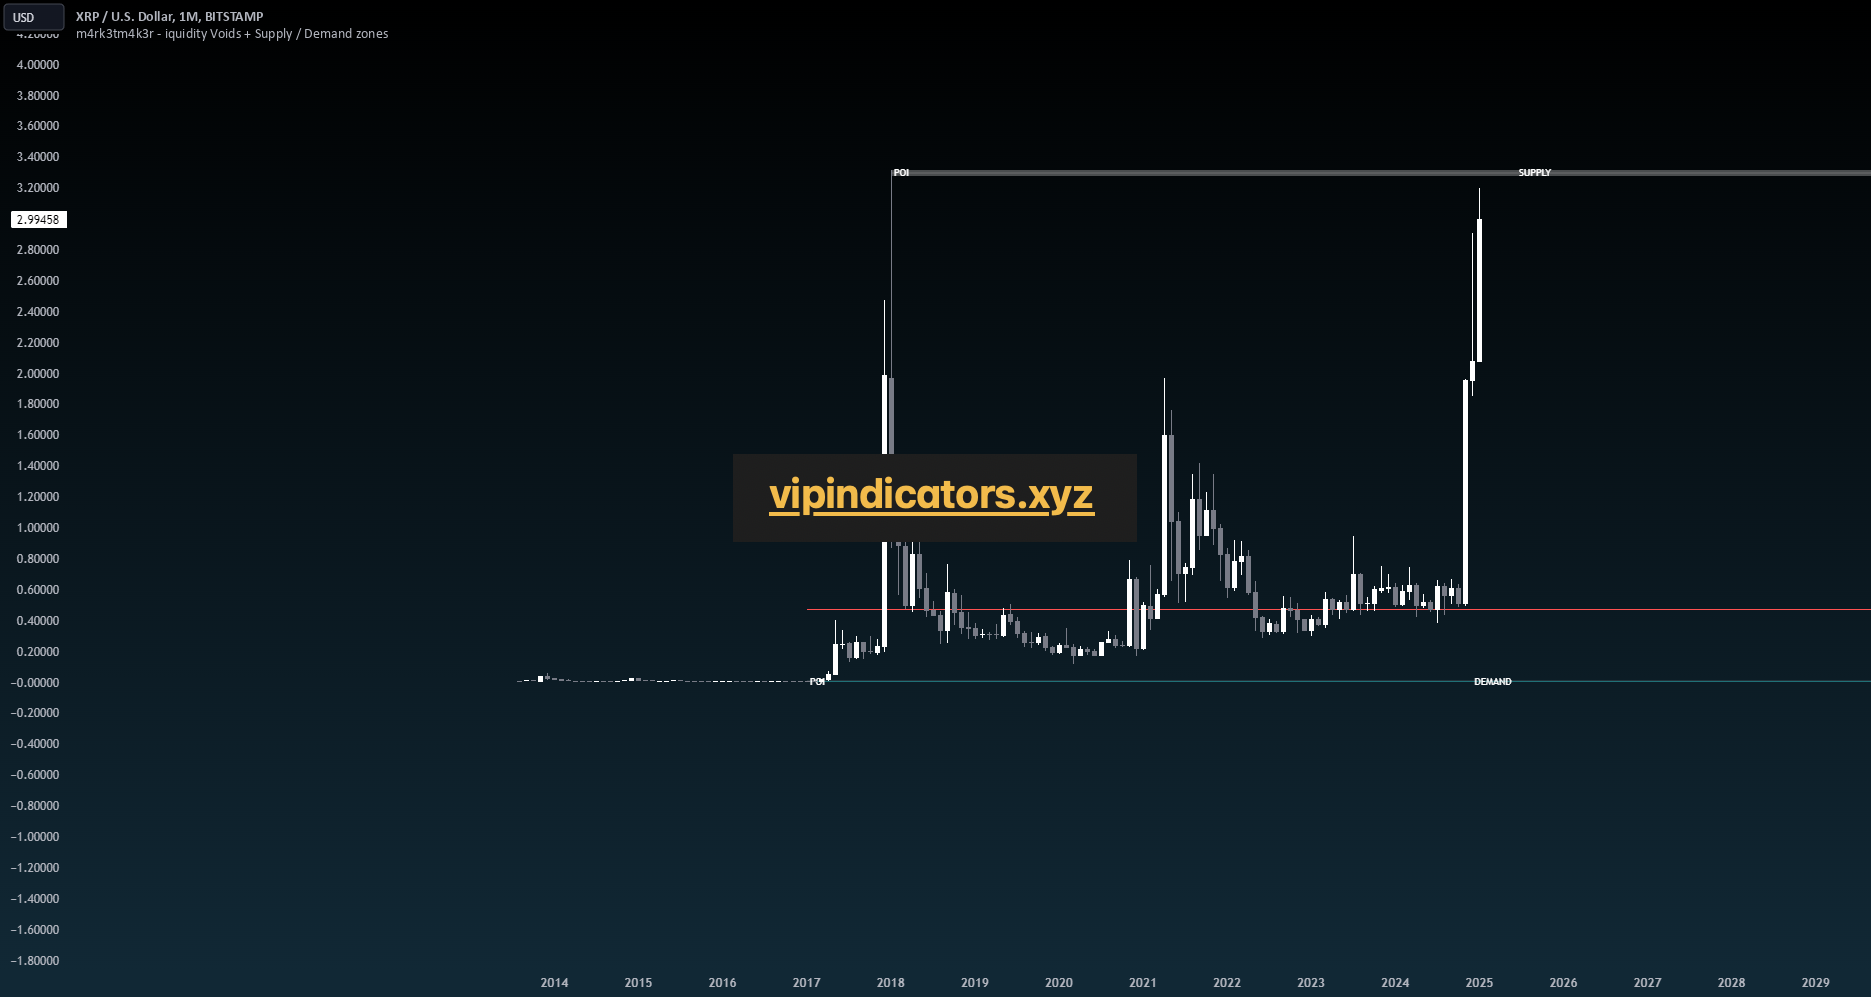
The weekly chart I posted illustrates our current position. Interestingly, the discount zone dating back to 2017 still shows a noticeable imbalance. The red line marks the boundary between premium and discount, which may indicate heightened market interest—especially given that we’re looking at more than seven years of data.
So how should one trade XRP at this point? I’m by no means an expert, but I’ve learned the hard way that trading near all-time highs (ATHs) can be both highly risky and potentially very profitable—a real gamble. One essential lesson I’ve picked up, though, is that as price approaches an ATH, it’s wise to move down to lower time frames for more precise entries and exits.
An example is given by the following set of 0-lagged indicators (some of the have been created by myself and are still in testing mode before to release them publicly)
The above chart shows respectively 4 aspects:
– Liquidity voids and gaps on the M1 time frame
– A somewhat unconventional yet effective way of visualizing volumes (gray lines represent sellers, white lines represent buyers)
– An even more unusual method for detecting volume entries in the second pane. I wrote this indicator to highlight only significant volume spikes, shown whenever they cross the light-green threshold
– Lastly, a simple log-expanded comparison of the inverted price.
If we jump into the m5 TF we can spot additional blind spots:
The 2nd pane of the m5 time-frame is showing a decreasing in volume activities and considering what mentioned earlier, the sellers are winning against the buyers
Let’s now take a look to the m15 time-frame which is one of the most controversial time frame that traders are normally looking at:
– The first pane shows a large liquidity void created by rapid selling activity when the price approached 3.2. From the M15 perspective, it appears this void is pushing the price upward to be refilled. However, M15 volume analysis indicates that volumes are still decreasing, and sellers remain in control as demonstrated in the m5 time-frame.
XRP
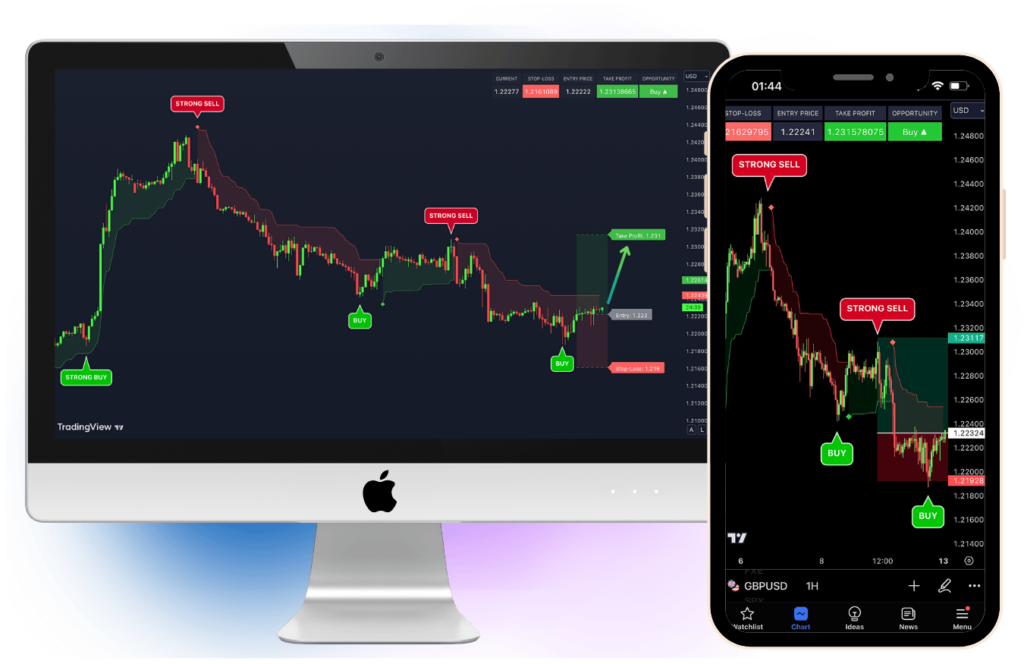
Leveraging AI Indicators for Perfect Trades
In the unpredictable world of cryptocurrency trading, missing the right moment to sell can turn a winning trade into a missed opportunity—or worse, a loss. AI-driven indicators take the guesswork out of this critical decision by analyzing real-time market trends, historical data, and trading patterns to pinpoint the optimal entry & exit points. With these tools, you gain an edge that no manual analysis can provide, ensuring you lock in profits at the perfect time and avoid the costly mistakes of emotional decision-making.
Think about it: how many times have you hesitated to sell, hoping for a bigger return, only to watch the market reverse? AI indicators eliminate this uncertainty, offering actionable insights backed by data. They not only empower you to sell at the top but also help safeguard your profits by alerting you to potential downturns. Whether you’re new to trading or a seasoned veteran, leveraging AI indicators is not just a tool—it’s an essential strategy for success in today’s fast-moving markets.