Blog
-
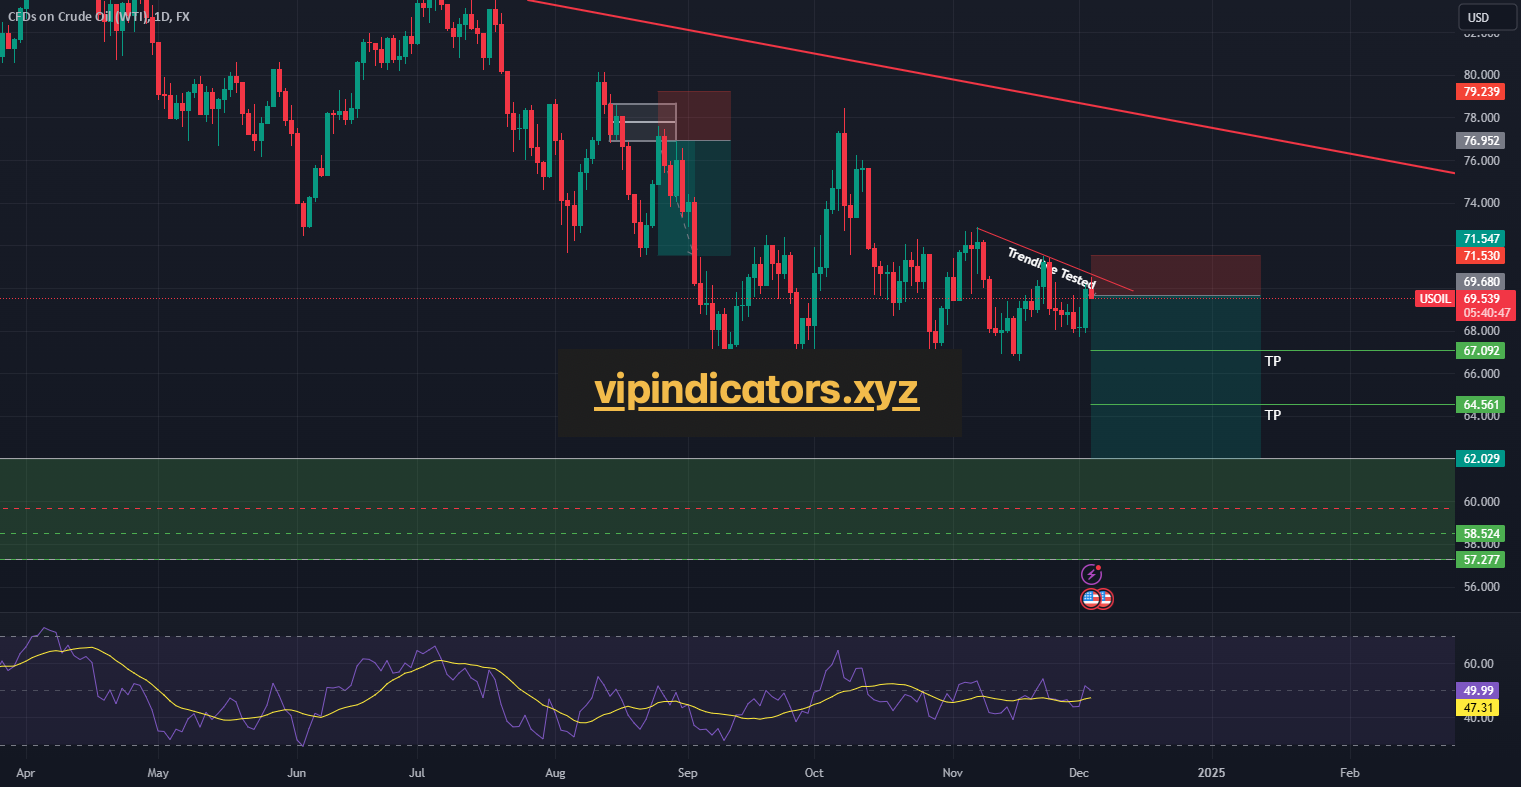
CFDs on Crude Oil (WTI)
. Market Analysis:
Asset: WTI (US Oil)
Timeframes:
1-Hour: Bearish divergence observed, suggesting weakening bullish momentum.
Daily: Trendline resistance tested and validated with three touchpoints, reinforcing its strength.
2. Divergence and Trendline Details:
Bearish Divergence: The price is making higher highs on the 1-hour chart, while oscillators (RSI, MACD) are making lower highs, signaling potential reversal to the downside.
Trendline Resistance: On the daily chart, the trendline has been tested three times, confirming a strong resistance area.
3. Trade Setup:
Entry Point:
Enter a short position once a bearish confirmation candle forms on the 1-hour chart (e.g., bearish engulfing or shooting star).
Alternatively, use a sell stop order just below the most recent 1-hour low to confirm the downward momentum.
Stop-Loss:
Place the stop-loss above the recent swing high on the 1-hour chart to account for potential volatility near resistance.
Take-Profit:
Aim for a 1:2 or higher risk-reward ratio.
Target key support levels or Fibonacci retracement zones on the 4-hour or daily chart.
4. Risk Management:
Position Size: Calculate based on the distance between entry and stop-loss, risking no more than 1-2% of trading capital.
Risk-Reward Ratio: Prioritize setups with at least a 1:2 risk-reward ratio to ensure favorable potential outcomes.
5. Additional Confirmation:
Volume Analysis: Look for decreasing volume as the price approaches the resistance trendline, signaling reduced bullish strength.
Support-Resistance Levels: Ensure targets align with well-defined support zones from prior price action.
6. Trade Execution:
Place Orders:
Set a sell order with predefined stop-loss and take-profit levels.
Monitor for bearish momentum indicators, such as trendline rejection or break of lower time-frame support.
Adjust Stops: If the price moves in your favor, trail the stop-loss to lock in profits as the trade develops. -
Euro / U.S. Dollar
Analysis:
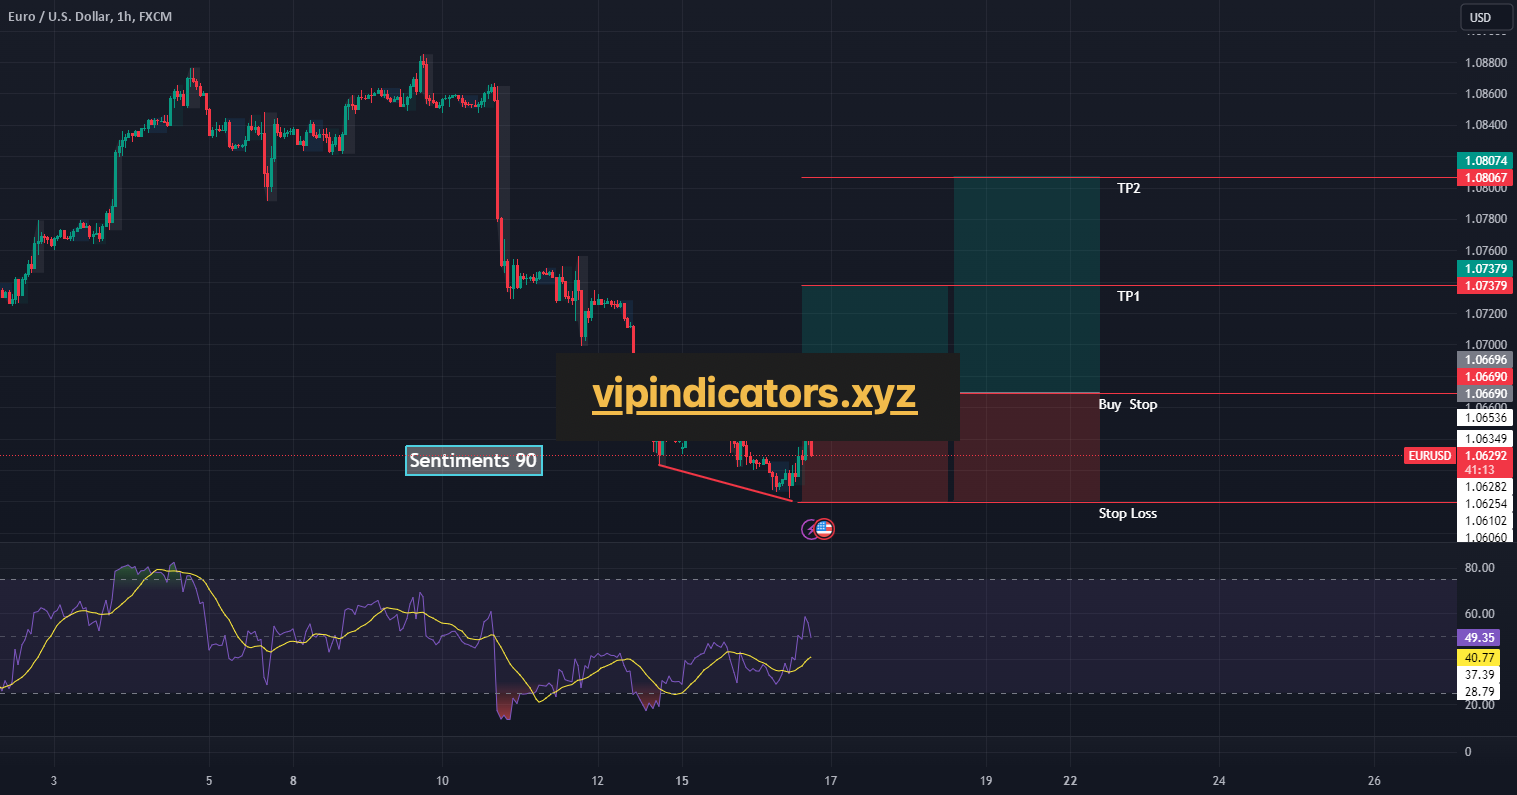
Sentiment Analysis: The sentiment analysis indicates a strong bullish bias, with 90% of traders favoring a long setup on EURUSD. This sentiment alignment suggests a potential bullish momentum in the market.
Divergence: Divergence between price and indicators like MACD or RSI on the 1-hour and 4-hour charts can signal a potential reversal or continuation of the trend. In this case, the divergence supports the bullish thesis, indicating a possible upward movement in EURUSD.
Technical Indicators:
Buy Stop Order: Placing a buy stop order above the current market price allows traders to enter a long position once the price surpasses a specified level, confirming the continuation of the bullish momentum.
Trade Setup:
Entry: Set a buy stop order slightly above the current resistance level, which is typically the recent swing high or a key resistance level identified on the 1-hour or 4-hour chart. This ensures entry into the trade once the price breaks out above resistance, validating the bullish momentum.
Stop-loss: Place the stop-loss order below the nearest support level or the recent swing low to limit potential losses if the price reverses. Consider setting the stop-loss based on your risk tolerance and the volatility of the EURUSD pair.
Take-profit: Determine the take-profit target based on key resistance levels identified on higher timeframes, Fibonacci extensions, or a favorable risk-reward ratio. Consider trailing your stop-loss to lock in profits as the trade progresses.
Risk Management:
Position Size: Calculate your position size based on your risk tolerance and the distance between your entry point and stop-loss level, ensuring that you only risk a predetermined percentage of your trading capital per trade.
Risk-Reward Ratio: Aim for a risk-reward ratio of at least 1:2 or higher to ensure that potential profits outweigh potential losses.
Conclusion:
With strong bullish sentiment and divergence observed on the 1-hour and 4-hour charts, a long EURUSD trade with a buy stop order presents a compelling opportunity. However, always conduct thorough analysis, practice proper risk management, and remain vigilant for any unexpected market developments. -
CFDs on WTI Crude Oil
Trade Idea: Short US Oil (WTI Crude Oil)
Analysis:
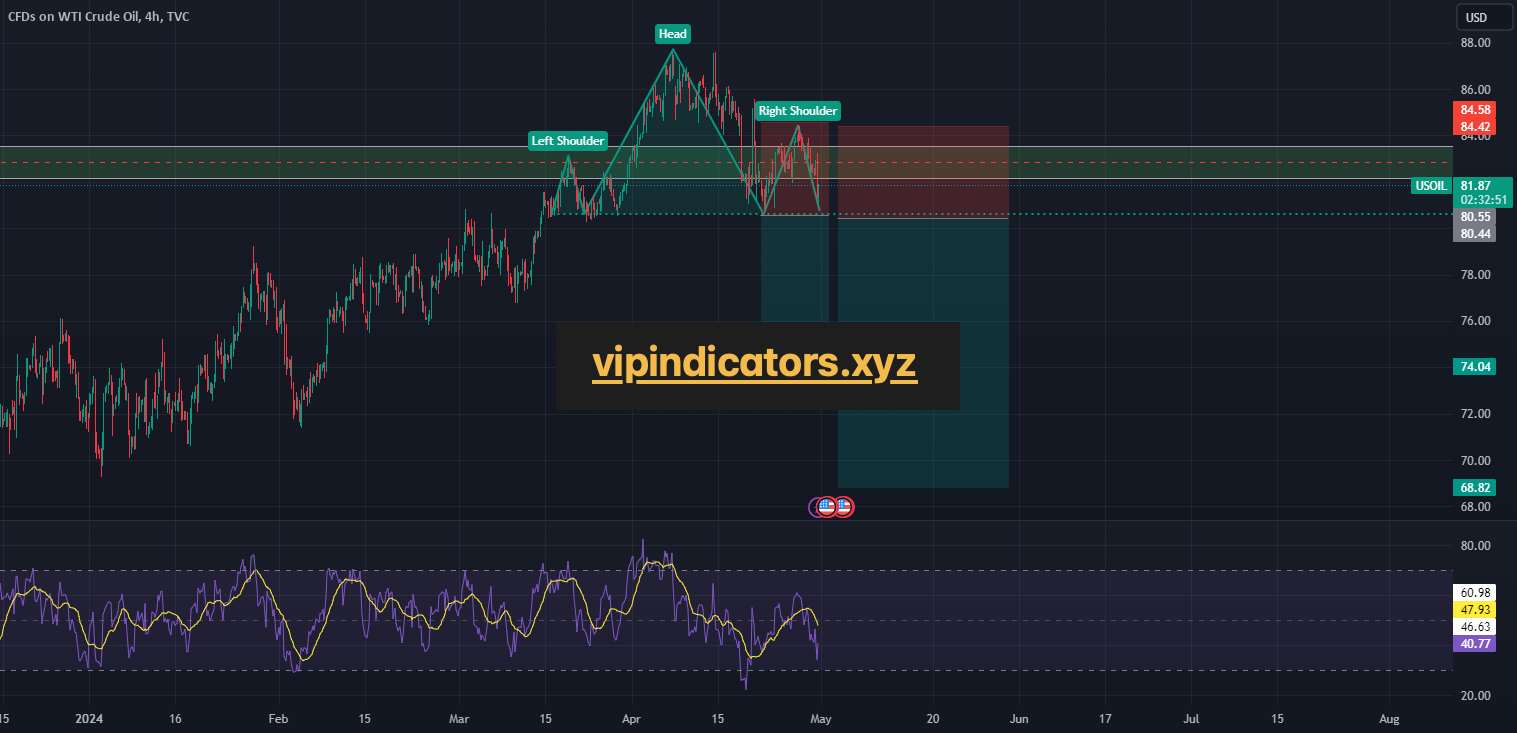
Head and Shoulders Pattern: The Head and Shoulders pattern is a classical reversal pattern that typically forms after an uptrend and indicates a potential trend reversal to the downside. In this case, the presence of a Head and Shoulders pattern on US Oil suggests a possible reversal from bullish to bearish sentiment.
Technical Indicators:
Confirmation: Look for additional technical indicators or chart patterns to confirm the potential reversal signaled by the Head and Shoulders pattern. This could include bearish divergence on oscillators like RSI or MACD, bearish candlestick patterns, or a break below key support levels.
Trade Setup:
Entry: Place a sell stop order below the neckline of the Head and Shoulders pattern. The neckline acts as a key support level, and a break below this level confirms the pattern’s completion and the potential downtrend continuation. Ensure the entry is triggered only when the price breaches the neckline.
Stop-loss: Set the stop-loss order above the recent swing high or above the right shoulder of the Head and Shoulders pattern to protect against potential losses if the price reverses unexpectedly. Place the stop-loss level outside of the pattern to avoid being stopped out by normal market fluctuations.
Take-profit: Determine the take-profit target based on key support levels, Fibonacci extensions, or a favorable risk-reward ratio. Consider scaling out of the position as the trade progresses to lock in profits.
Risk Management:
Position Size: Calculate your position size based on your risk tolerance and the distance between your entry point and stop-loss level, ensuring that you only risk a predetermined percentage of your trading capital per trade.
Risk-Reward Ratio: Aim for a risk-reward ratio of at least 1:2 or higher to ensure that potential profits outweigh potential losses.
Conclusion:
With the formation of a Head and Shoulders pattern indicating a potential reversal to the downside for US Oil, a short position presents a favorable trading opportunity. However, always conduct thorough analysis, practice proper risk management, and remain vigilant for any unexpected market developments. -
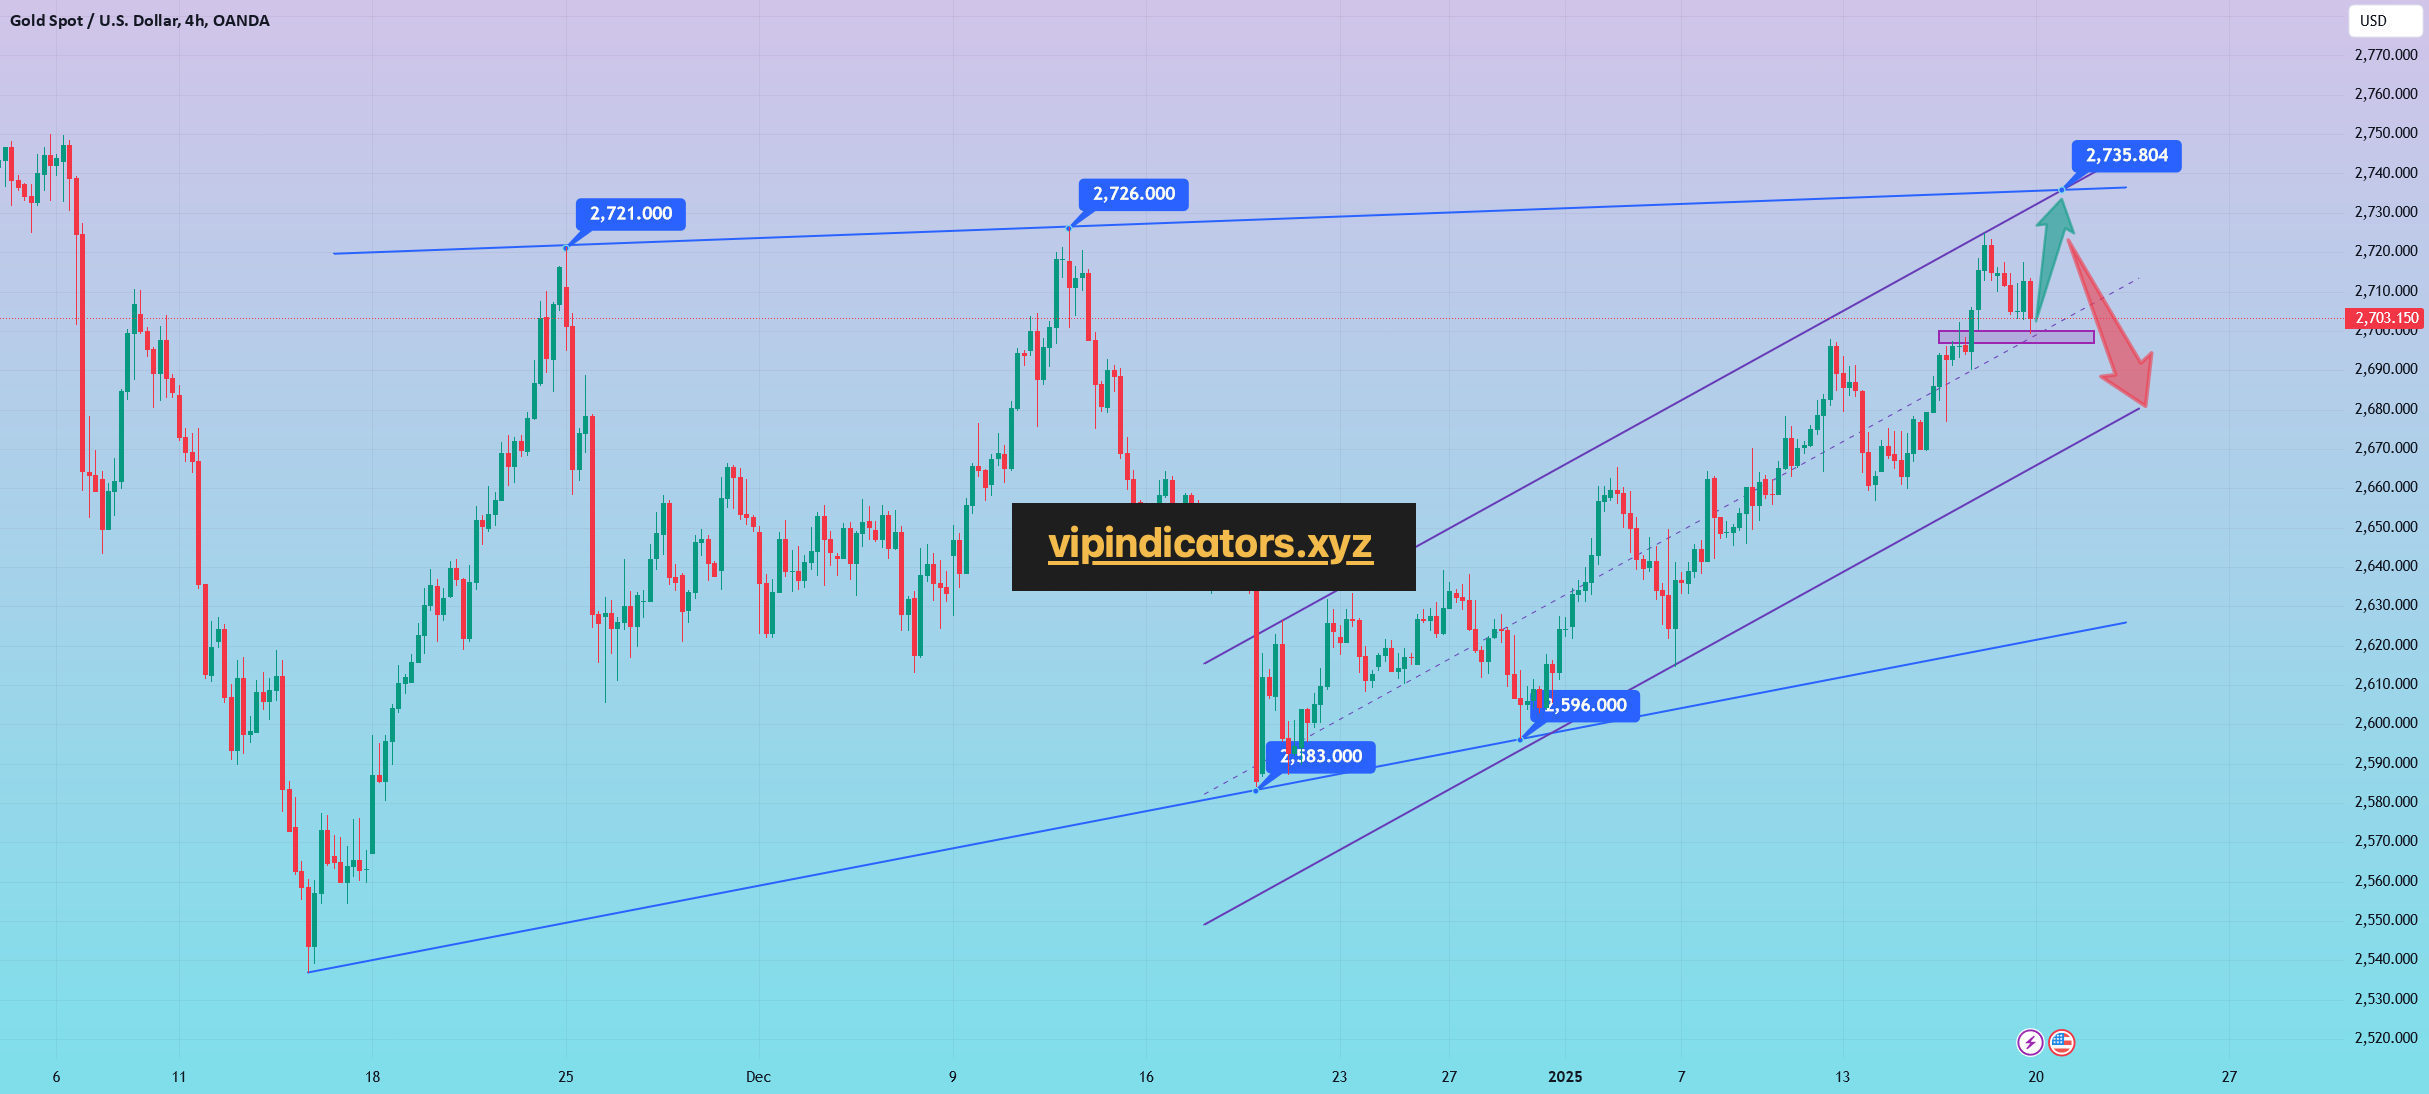
Gold Spot / U.S. Dollar
Hello friends
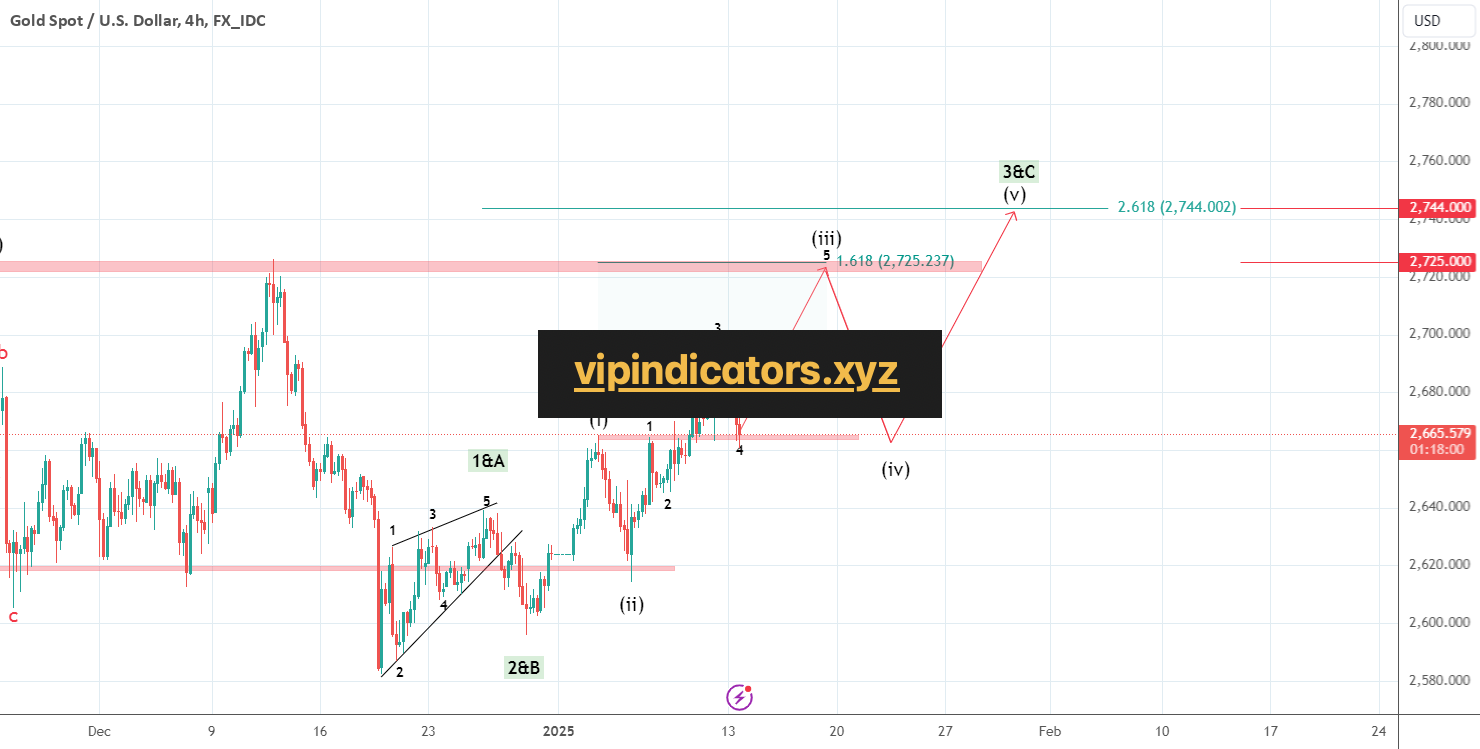
On the Gold chart, we are witnessing the formation of a 5-wave bullish pattern, which indicates an increase in the value of gold. These 5 bullish waves are wave 5 of 3. Now this wave is wave 3 of 3 or C. That is, we are faced with two scenarios, in both scenarios the price should increase.
Anyway, we expect the price to grow to the $2725 range, and the second target is the $2744 range.
Be successful and profitable. -
Natural Gas (XNGUSD)
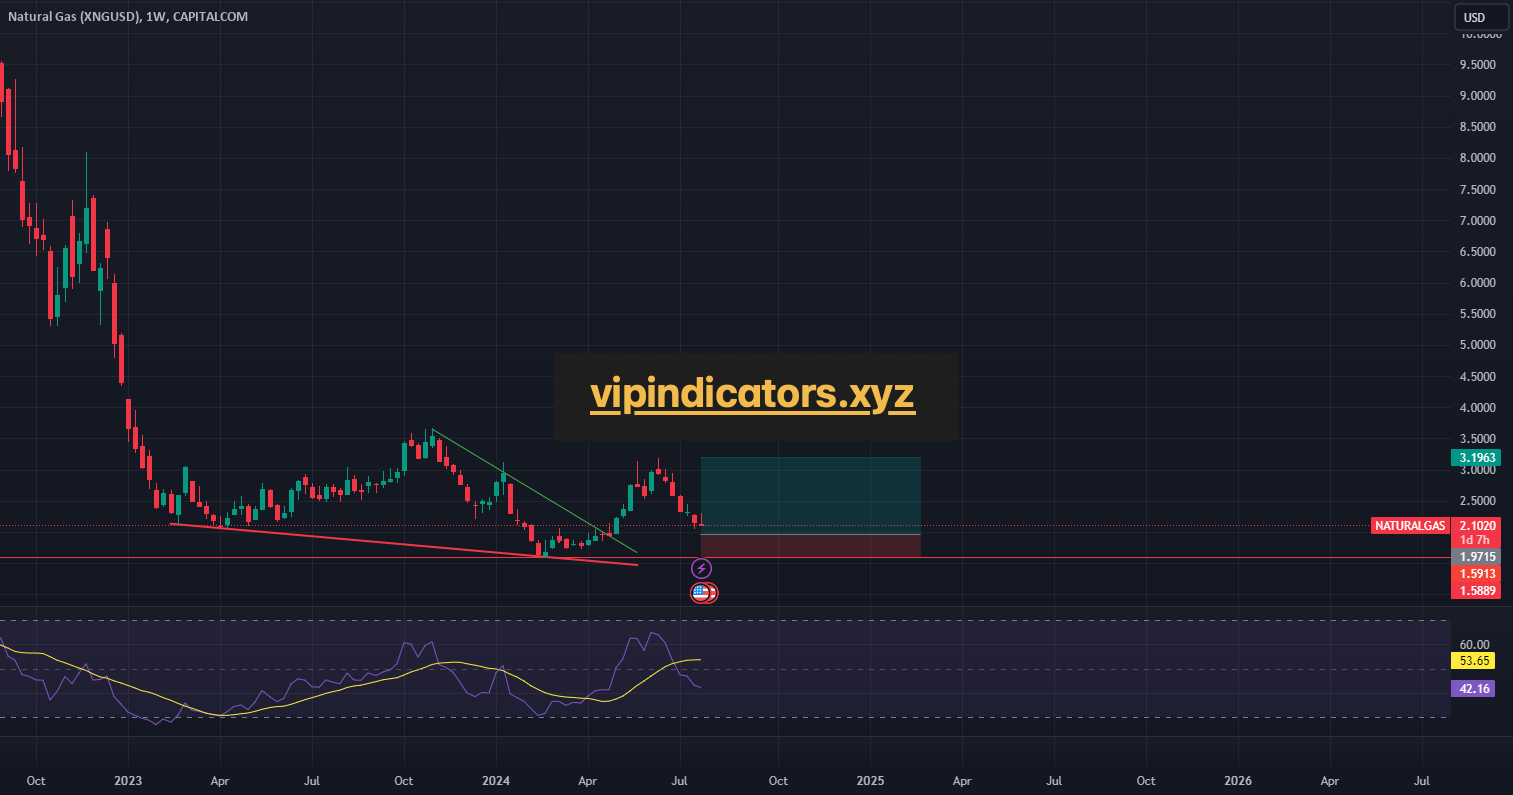
Title: Long Natural Gas Based on Bullish Divergence and Weekly Order Block
Trade Setup:
– Asset: Natural Gas
– Timeframes: Daily and Weekly
– Entry: Buy at the close of a bullish candlestick pattern confirming divergence on the daily chart
– Stop-Loss: Below the weekly order block or recent swing low
– Take-Profit: Based on key resistance levels or a 1:3 risk-reward ratio
Analysis:
– Bullish divergence confirmed on the daily timeframe
– Price in a weekly order block, indicating strong support
– Volume supports potential bullish reversal
Trade Plan:
– Enter long position on daily bullish confirmation within the weekly order block
– Set stop-loss below the weekly order block or recent swing low
– Take profit at key resistance levels or using a 1:3 risk-reward ratio
– Risk 1-2% of trading capital
This trade plan aligns with the technical analysis and provides a structured approach to capitalizing on the potential bullish reversal in Natural Gas. -

https://www.tradingview.com/chart/BTCUSD/fvRCJek1-Bitcoin-continues-to-rise/
https://www.tradingview.com/chart/BTCUSD/fvRCJek1-Bitcoin-continues-to-rise/
-
https://www.tradingview.com/chart/EURUSD/9jBkkcG1-EURUSD-Ahead-of-the-US-CPI-Data/
https://www.tradingview.com/chart/EURUSD/9jBkkcG1-EURUSD-Ahead-of-the-US-CPI-Data/