Blog
-
SOL / TetherUS
Hey Realistic Traders, Will

 SOLUSDT Create New All-Time High? Let’s dive into the analysis…
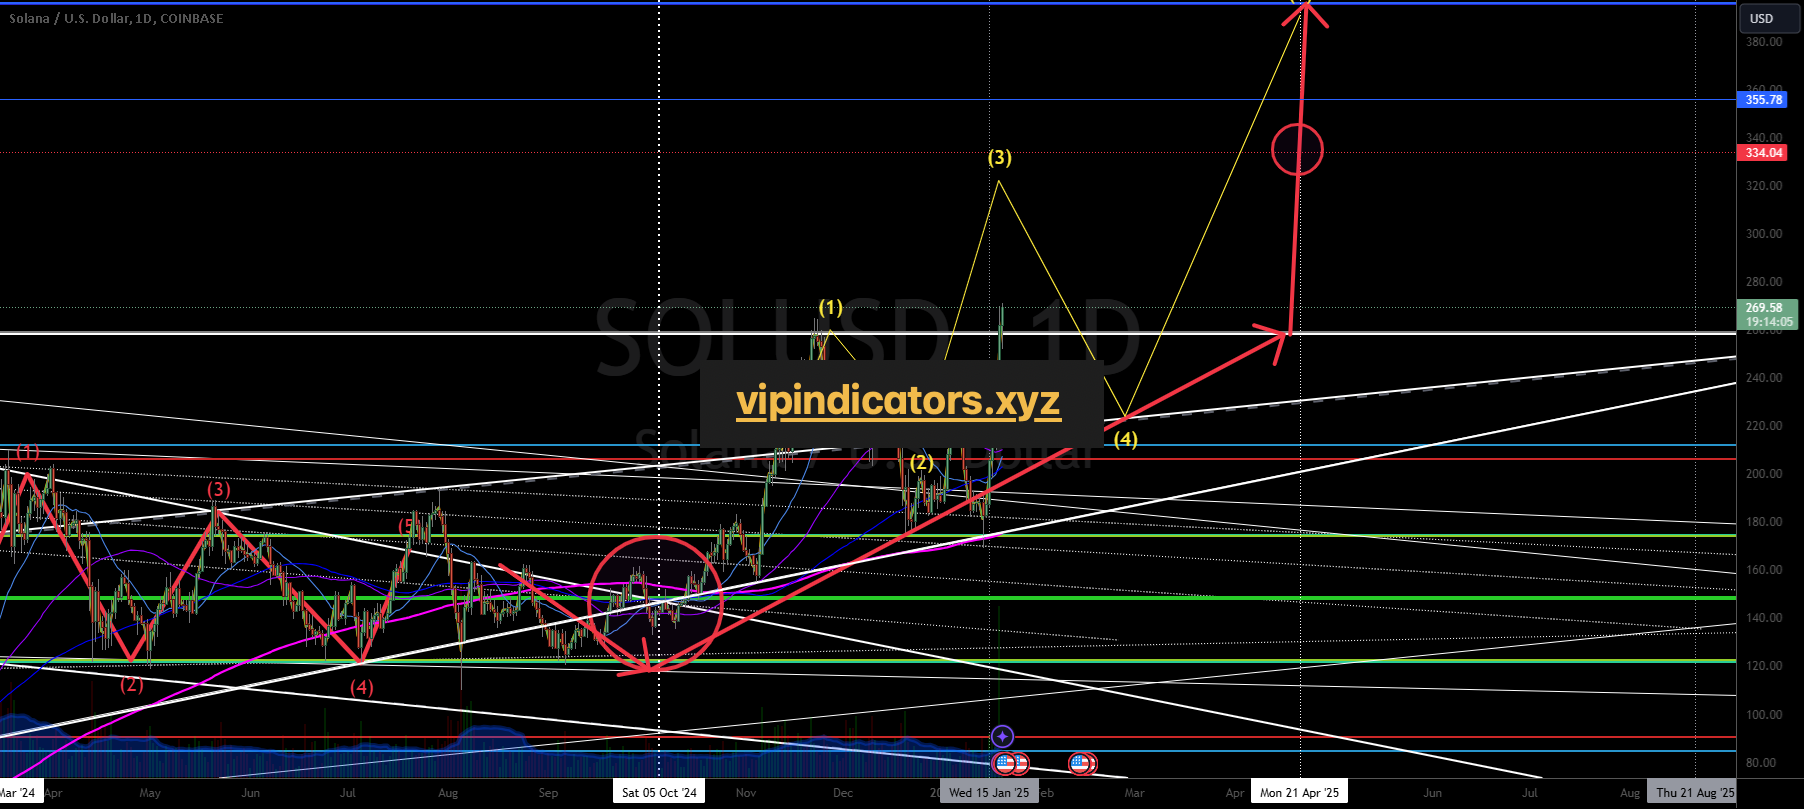
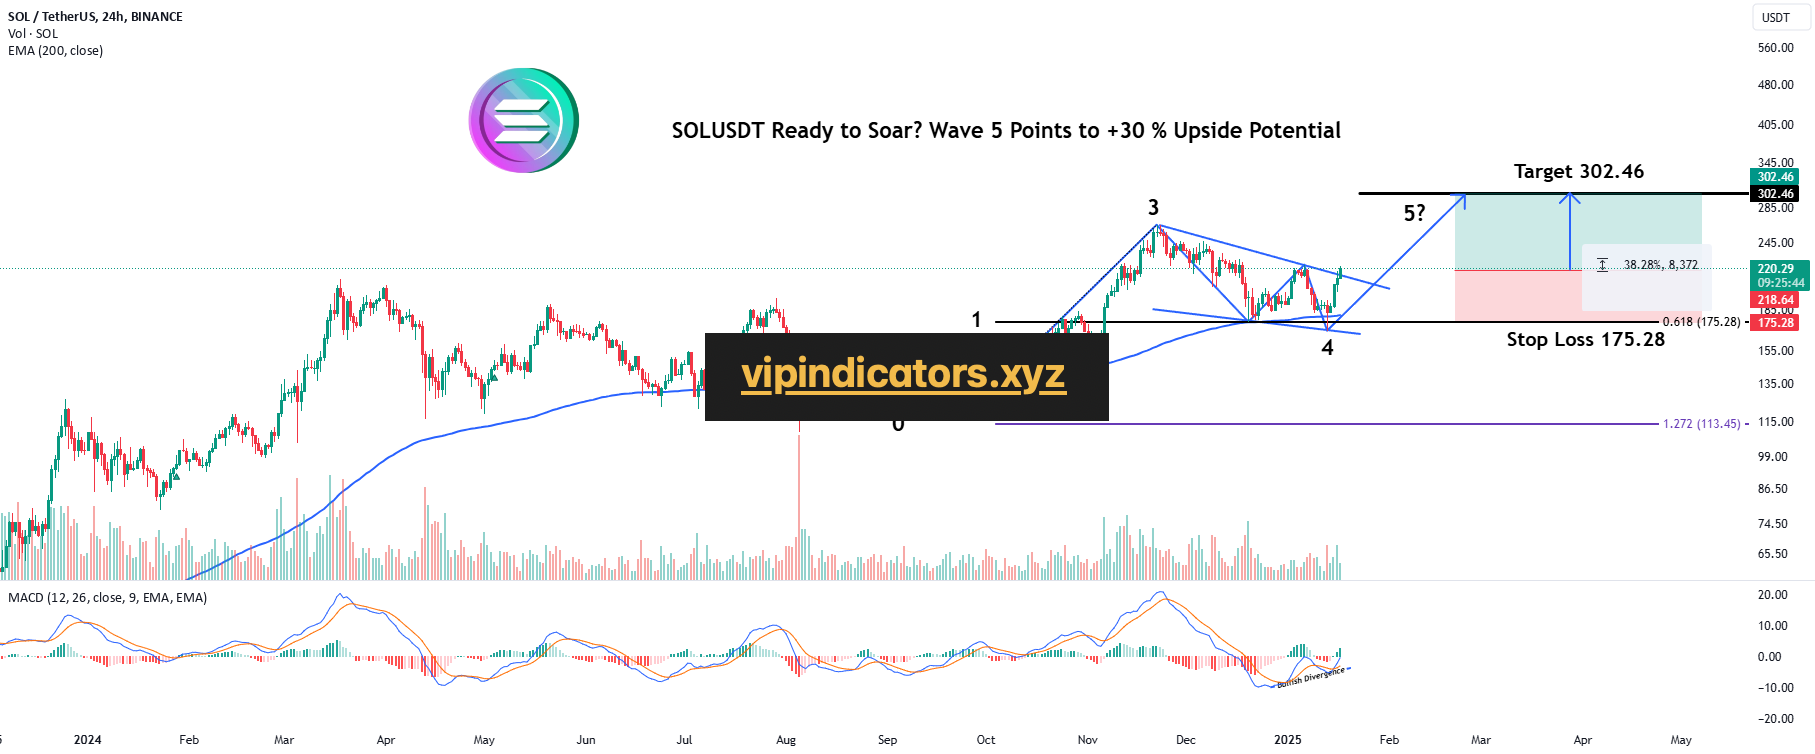
Analyzing Solana’s (SOLUSDT) price movements using Elliott Wave Theory indicates the potential for a significant upside in Wave 5. Wave 3 previously extended beyond the 1.618 Fibonacci extension, classifying it as an extended wave. Following this, Wave 4 retraced approximately to the 0.618 Fibonacci level, forming a falling wedge pattern, which is a bullish signal.
The breakout from this falling wedge on the 4-hour chart, combined with a bullish divergence in the MACD indicator, suggests the possible initiation of Wave 5. However, as Wave 5 is expected to be a standard wave rather than an extended one, its movement may be relatively limited compared to the high of Wave 3.
Based on these technical signals, the price is projected to rise toward the $302.46 target, provided it holds above the critical stop loss level of $175.28.
Support the channel by engaging with the content, using the rocket button, and sharing your opinions in the comments below.
“Disclaimer: “Please note that this analysis is solely for educational purposes and should not be considered a recommendation to take a long or short position on Solana”. -
Litecoin / TetherUS PERPETUAL CONTRACT
Title: SOL/USDT Breakout Success | Profit Booked at $260
Description:
This video covers my recent trade on SOL/USDT, where I capitalized on a strong breakout above key resistance levels. After identifying a clear bullish structure supported by volume and momentum, I entered the trade and booked profit at $260. The price aligns well with the 1.618 Fibonacci extension, validating the analysis.
Key Highlights:
Breakout Confirmation:
SOL broke out of the descending triangle pattern with significant volume.
Strong bullish candle closures confirmed the breakout.
Momentum Indicators:
RSI in the overbought region indicates strong upward pressure.
ADX confirmed a strengthening bullish trend.
Profit Booking:
Exited at $260 as price approached key resistance near the Fibonacci target.
Support Levels to Watch:
$226.6 for potential pullbacks and re-entry zones.
Market Context:
Bitcoin’s bullish trend further supported the SOL breakout, boosting confidence in the trade.
Conclusion:
This trade demonstrates the power of aligning technical analysis with momentum and volume. Watch the video for detailed insights, including entry, exit, and post-trade analysis. Feel free to share your feedback and ideas!