Blog
-
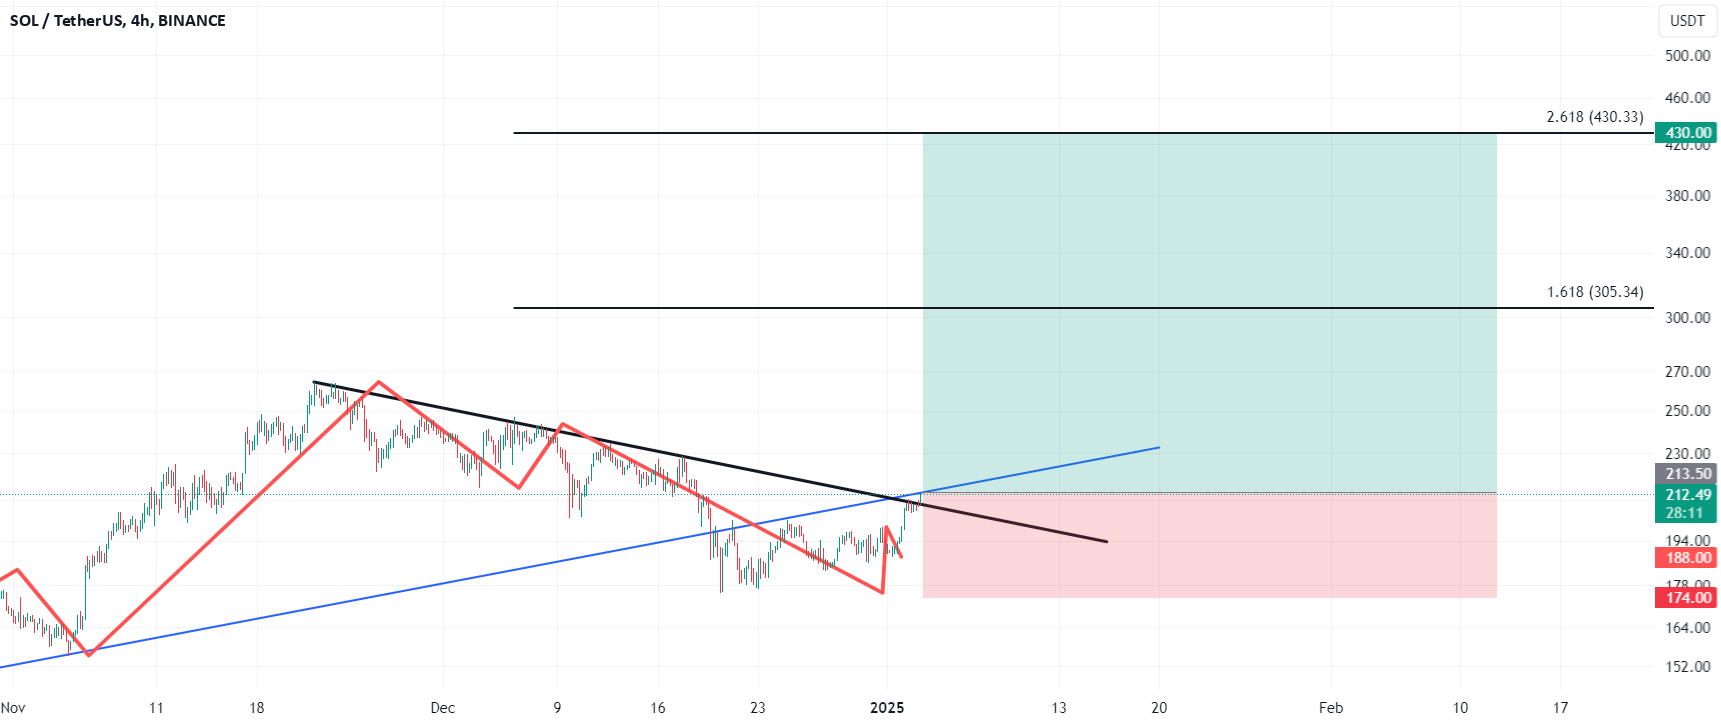
SOL / TetherUS
📉 Analysis: Solana (SOL) has completed an ABC correction and successfully broken its descending trendline, signaling the start of a strong bullish move. This setup offers an excellent 100% profit potential with a 1:5.5 risk-reward ratio.
📌 Key Levels:
– 🔹 Entry Point: 213.50 USD
– 🔹 Stop Loss: 174.00 USD
– 🔹 Take Profit: 430.00 USD
📊 Outlook: The break above the descending trendline confirms a change in momentum, making SOL ready for its next major move upwards. A perfect setup for traders looking for high returns with calculated risk.
📢 Share your thoughts! Don’t forget to share this signal with your trading circle and let us know your plans in the comments. -
Gold Spot / U.S. Dollar
XAU/USD Analysis (Gold Spot/USD)
📊 Timeframes Analyzed:
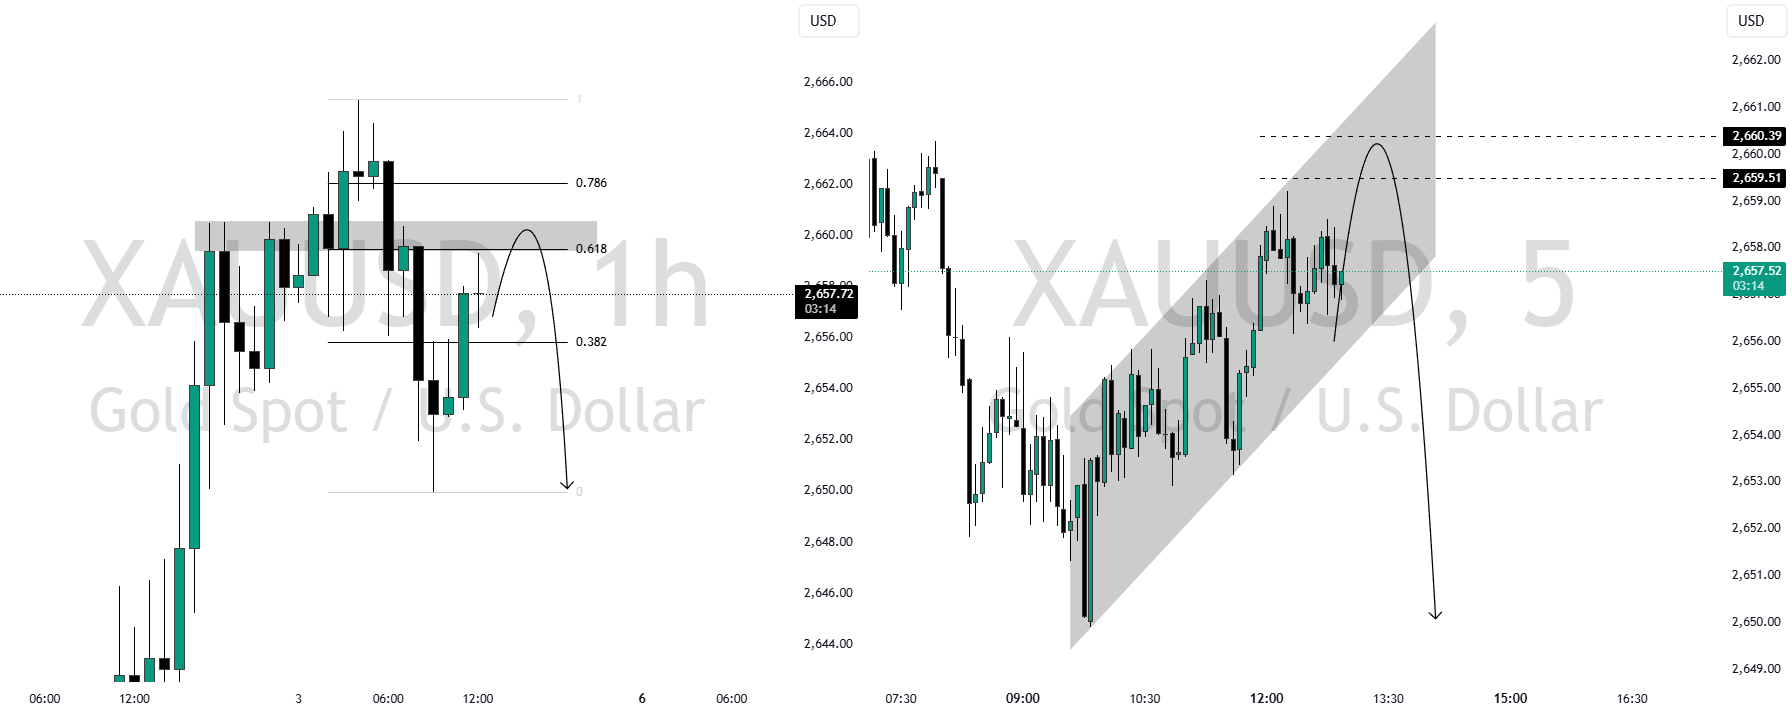
– 1H Chart:
The price is currently trading at $2,657, consolidating near the key resistance zone between $2,659 and $2,660. This area aligns with the 61.8% Fibonacci retracement level, which has historically acted as a strong supply zone. Price action shows multiple attempts to break above this level, but bearish pressure has kept it contained so far.
A potential rejection here could lead to a pullback toward the $2,654-$2,650 support range, while a breakout above $2,660 could trigger a bullish continuation toward $2,666.
– 5m Chart:
Zooming in, the price is moving within a rising channel, showing short-term bullish momentum. However, the channel’s upper boundary aligns with the higher timeframe resistance zone ($2,659-$2,660), suggesting that the bullish move may face exhaustion soon. A rejection from this level could result in a breakdown of the channel and a retest of lower supports around $2,652-$2,650.
🔑 Key Levels:
– Resistance Zone: $2,659 – $2,660
– Support Levels: $2,654 and $2,650
📈 Outlook:
The current price action suggests that gold is at a critical juncture:
– Bullish Scenario:
– A breakout above the resistance zone at $2,660 (confirmed by strong candle closures and volume spikes) could lead to a continuation toward higher targets like $2,666 or $2,670.
– This scenario would align with the broader bullish sentiment seen in recent sessions.
– Bearish Scenario:
– If the price fails to break above $2,660 and shows signs of rejection (e.g., long upper wicks or bearish engulfing patterns), we could see a pullback toward immediate support levels at $2,654 or $2,650.
– A breakdown below $2,650 could open the door for further downside toward $2,644.
💡 Note: Watch for confirmation signals such as volume spikes or clear candlestick patterns before entering trades.
🌍 Fundamental Analysis:
Positive Factors Supporting Gold:
– Global Economic Uncertainty:
Concerns about slowing global growth and geopolitical tensions (e.g., ongoing instability in Eastern Europe) are driving demand for safe-haven assets like gold.
– Weaker U.S. Dollar:
The U.S. Dollar Index (DXY) has shown signs of weakness recently due to expectations that the Federal Reserve may pause rate hikes in early 2025. A weaker dollar typically supports gold prices as it becomes cheaper for holders of other currencies.
– Seasonal Demand:
January often sees increased demand for gold due to seasonal factors such as jewelry purchases in Asian markets and portfolio rebalancing by institutional investors.
Risks/Negative Factors for Gold:
– Hawkish Federal Reserve Policy:
Despite speculation about a pause in rate hikes, any unexpected hawkish commentary from the Fed in its upcoming January meeting could strengthen the dollar and pressure gold prices downward.
– Profit-Taking Near Resistance:
With gold nearing key resistance levels ($2,660), short-term traders may take profits, leading to temporary pullbacks.
– Equity Market Recovery:
If global equity markets continue their recovery into early 2025, it could reduce demand for safe-haven assets like gold.