. Market Analysis:
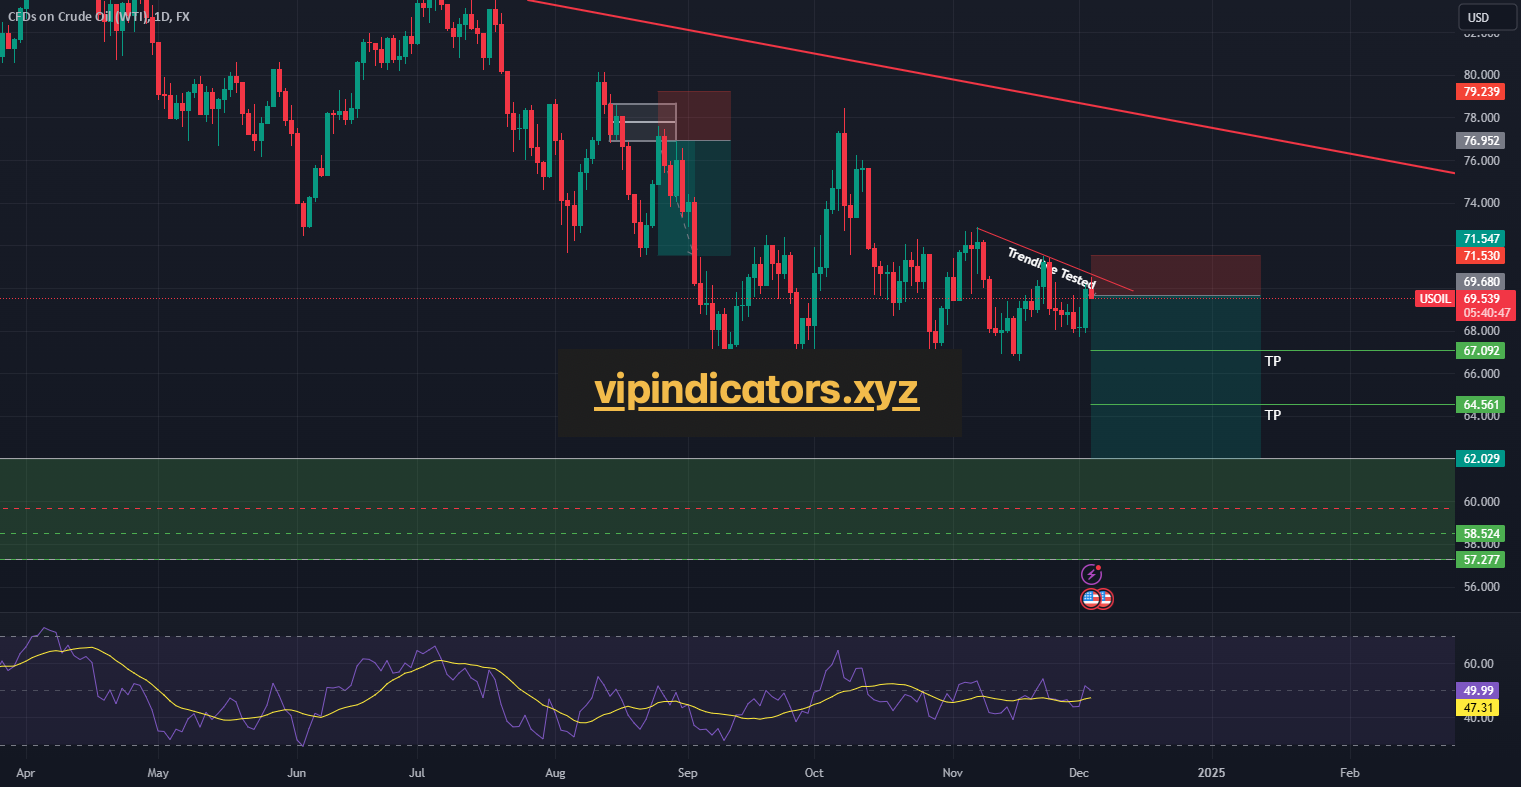
Asset: WTI (US Oil)
Timeframes:
1-Hour: Bearish divergence observed, suggesting weakening bullish momentum.
Daily: Trendline resistance tested and validated with three touchpoints, reinforcing its strength.
2. Divergence and Trendline Details:
Bearish Divergence: The price is making higher highs on the 1-hour chart, while oscillators (RSI, MACD) are making lower highs, signaling potential reversal to the downside.
Trendline Resistance: On the daily chart, the trendline has been tested three times, confirming a strong resistance area.
3. Trade Setup:
Entry Point:
Enter a short position once a bearish confirmation candle forms on the 1-hour chart (e.g., bearish engulfing or shooting star).
Alternatively, use a sell stop order just below the most recent 1-hour low to confirm the downward momentum.
Stop-Loss:
Place the stop-loss above the recent swing high on the 1-hour chart to account for potential volatility near resistance.
Take-Profit:
Aim for a 1:2 or higher risk-reward ratio.
Target key support levels or Fibonacci retracement zones on the 4-hour or daily chart.
4. Risk Management:
Position Size: Calculate based on the distance between entry and stop-loss, risking no more than 1-2% of trading capital.
Risk-Reward Ratio: Prioritize setups with at least a 1:2 risk-reward ratio to ensure favorable potential outcomes.
5. Additional Confirmation:
Volume Analysis: Look for decreasing volume as the price approaches the resistance trendline, signaling reduced bullish strength.
Support-Resistance Levels: Ensure targets align with well-defined support zones from prior price action.
6. Trade Execution:
Place Orders:
Set a sell order with predefined stop-loss and take-profit levels.
Monitor for bearish momentum indicators, such as trendline rejection or break of lower time-frame support.
Adjust Stops: If the price moves in your favor, trail the stop-loss to lock in profits as the trade develops.
CFDs on Crude Oil (WTI)
Leveraging AI Indicators for Perfect Trades
In the unpredictable world of cryptocurrency trading, missing the right moment to sell can turn a winning trade into a missed opportunity—or worse, a loss. AI-driven indicators take the guesswork out of this critical decision by analyzing real-time market trends, historical data, and trading patterns to pinpoint the optimal entry & exit points. With these tools, you gain an edge that no manual analysis can provide, ensuring you lock in profits at the perfect time and avoid the costly mistakes of emotional decision-making.
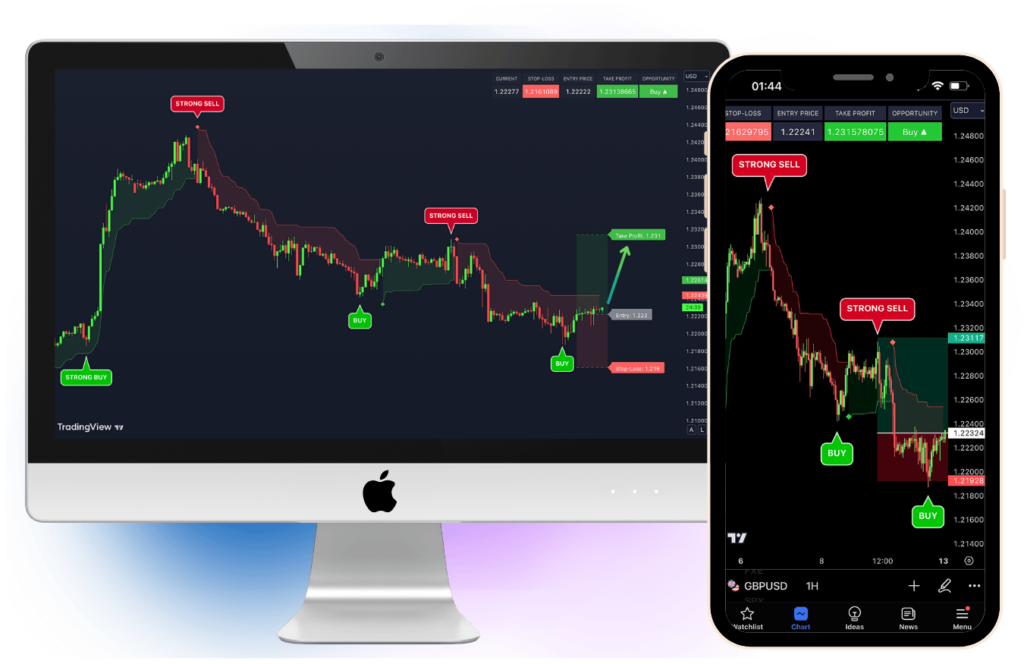
Think about it: how many times have you hesitated to sell, hoping for a bigger return, only to watch the market reverse? AI indicators eliminate this uncertainty, offering actionable insights backed by data. They not only empower you to sell at the top but also help safeguard your profits by alerting you to potential downturns. Whether you’re new to trading or a seasoned veteran, leveraging AI indicators is not just a tool—it’s an essential strategy for success in today’s fast-moving markets.