1. Market Analysis:
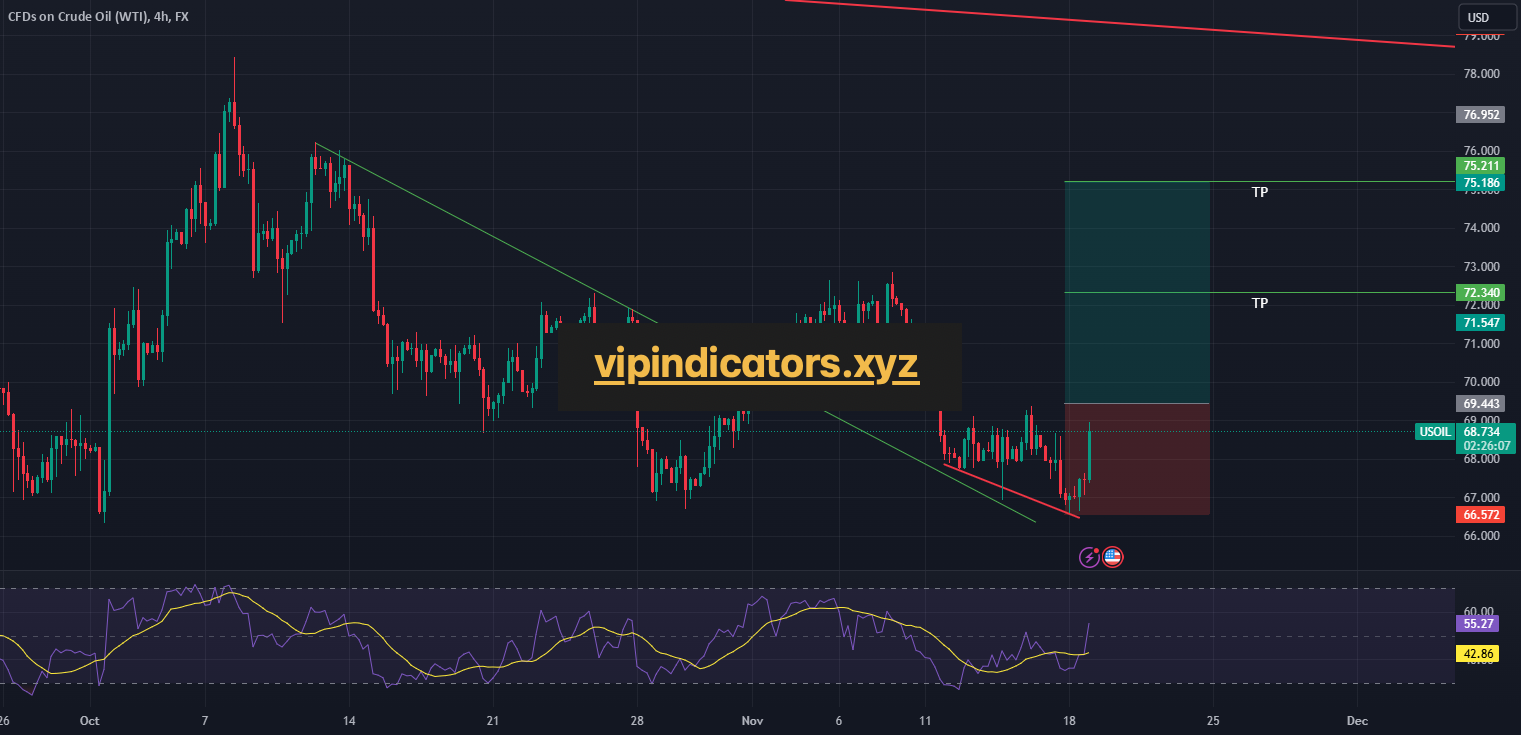
Asset: US Oil (WTI Crude)
Timeframes: 1-hour (1H) and 4-hour (4H)
Setup: Bullish divergence observed on both 1-hour and 4-hour timeframes
Support Level: Price is near a strong support zone, providing a solid base for a potential bounce.
2. Divergence Details:
Bullish Divergence: Both 1-hour and 4-hour charts are showing bullish divergence, indicating weakening bearish momentum as the price approaches strong support. This divergence can signal a potential reversal to the upside if confirmed by bullish price action.
3. Trade Setup:
Entry Point: Enter a long position when a bullish confirmation candle forms (such as a bullish engulfing or hammer candle) on the 1-hour chart after divergence confirmation. This candle should close above the support level for a stronger entry signal.
Stop-Loss: Place the stop-loss just below the strong support level to protect against further downside risk. This positioning ensures risk is limited in case the support does not hold.
Take-Profit: Aim for a 1:2 or higher risk-reward ratio, targeting the next resistance levels on the chart. Consider recent highs or Fibonacci retracement levels on the 4-hour timeframe as potential take-profit areas.
4. Risk Management:
Position Size: Determine position size based on risk tolerance, ensuring only a small percentage of capital is risked on this trade (e.g., 1-2%).
Risk-Reward Ratio: Aiming for at least a 1:2 risk-reward ratio provides an advantageous setup, enhancing potential reward relative to risk.
5. Additional Confirmation:
Volume Analysis: Look for an increase in volume on the 1-hour chart as the price bounces from support to confirm strong buying interest.
Support-Resistance Alignment: Ensure the support level aligns well with recent price structure and support zones on higher timeframes to reinforce the strength of this setup.
6. Trade Execution:
Place Orders: Set buy orders, stop-loss, and take-profit levels according to the criteria above.
Monitor the Trade: Manage the trade by adjusting the stop-loss to break even or trailing it if the price moves strongly in your favor.
7. Review and Adjust:
Post-Trade Analysis: After closing the trade, review the outcome to evaluate effectiveness and learn from the trade setup.
CFDs on Crude Oil (WTI)
Leveraging AI Indicators for Perfect Trades
In the unpredictable world of cryptocurrency trading, missing the right moment to sell can turn a winning trade into a missed opportunity—or worse, a loss. AI-driven indicators take the guesswork out of this critical decision by analyzing real-time market trends, historical data, and trading patterns to pinpoint the optimal entry & exit points. With these tools, you gain an edge that no manual analysis can provide, ensuring you lock in profits at the perfect time and avoid the costly mistakes of emotional decision-making.
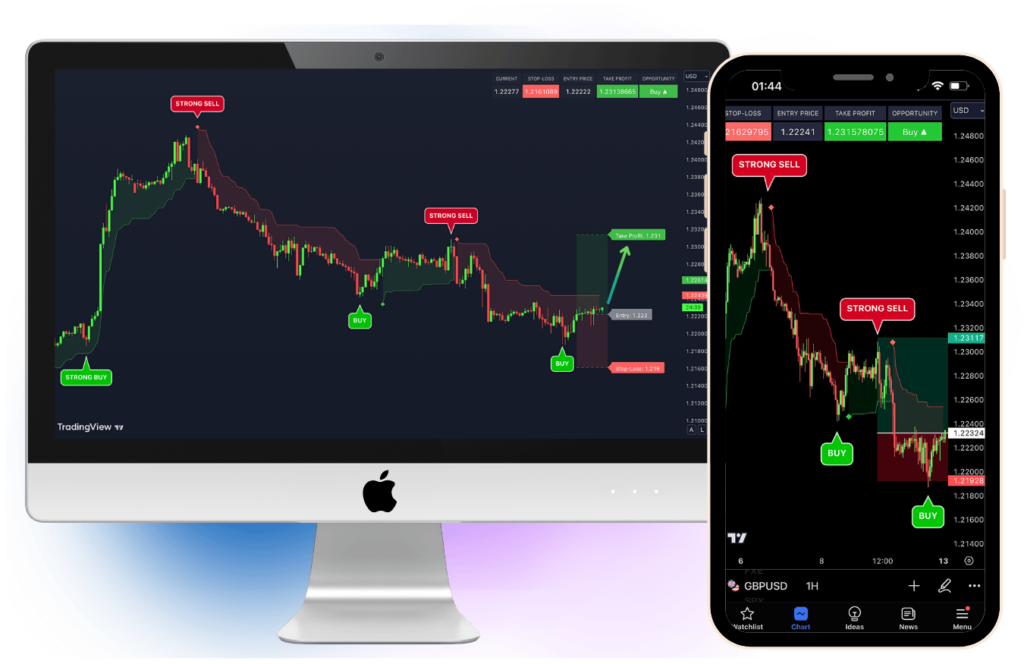
Think about it: how many times have you hesitated to sell, hoping for a bigger return, only to watch the market reverse? AI indicators eliminate this uncertainty, offering actionable insights backed by data. They not only empower you to sell at the top but also help safeguard your profits by alerting you to potential downturns. Whether you’re new to trading or a seasoned veteran, leveraging AI indicators is not just a tool—it’s an essential strategy for success in today’s fast-moving markets.